
Introduction
In the world of today, there is more data than ever. Just like crude oil is important to our economy, so is data. Owing to the rising importance of data analysis and demand for data analytics by companies all over the world, recruiters are scrambling to fill open positions.

According to research conducted by Statista, the global volume of data created and consumed is projected to reach 181 zettabytes by 2025 which is a lot that is going to need to be sorted, cleaned, analyzed, and visualized.
What is Data Analysis?
Data analysis is the process of collecting, modelling, and analyzing data using statistical and logical methods and techniques.

For ages now, 2.5 quintillion bytes of data are being generated daily. Data plays a crucial role in decision-making for business operators.
But, how well do you think you can deal with some much data? Well, there are several roles in the industry today that deal with data to gather insights and one such vital role is of a Data Analyst.
A simple example of data analysis can be seen whenever we decide our daily lives by evaluating what has happened in the past or what will happen if we make that decision.
This is the process of analyzing the past or future and making a decision based on that analysis.
Data Analysis Tools
Data Analysis tools are defined as a series of charts, maps, and diagrams designed to collect, interpret, and present data for a wide range of applications and industries.

A Data Analyst requires tools to gather insights from data because there are many software applications and tools available which are either designed for data modeling and visualizing data in bright colors and diagrams.
Tools for Data Analysis
There are different tools used to analyze data.

Here are some of the tools;
– Microsoft Excel
– Python
– R-programming
– Tableau
– MySQL
– Qlikview
– Jupyter Notebook
– SAS, etc.
The list goes on and on. They all have various features and different modes of operation, but we are just going to look at a few popular ones.
Microsoft Excel
Microsoft Excel is one of the most common software used for data analysis. Not only is it popular for data analysis, it is widely used for various purposes like office work, storing information, and keeping records.

Because of its simplicity and versatility, business owners and data analysts are able to use it to manage, sort, filter, clean, analyze and visualize data.
Analysing data in Excel empowers you to understand your data through natural language queries that allow you to ask questions about your data without having to write complicated formulas.
Python
Python is ranked as the most popular programming language in the world. Just like Excel, Python is easy to learn and can be used for various tasks including software and web, and data analysis.

One of the key features of Python that appeal to data analytics professionals is its many libraries, such as Pandas and Numpy which offer a variety of powerful tools for many analytic needs.
R-Programming
Just like Python and Excel, R is one of the most important programming languages used in data analysis.
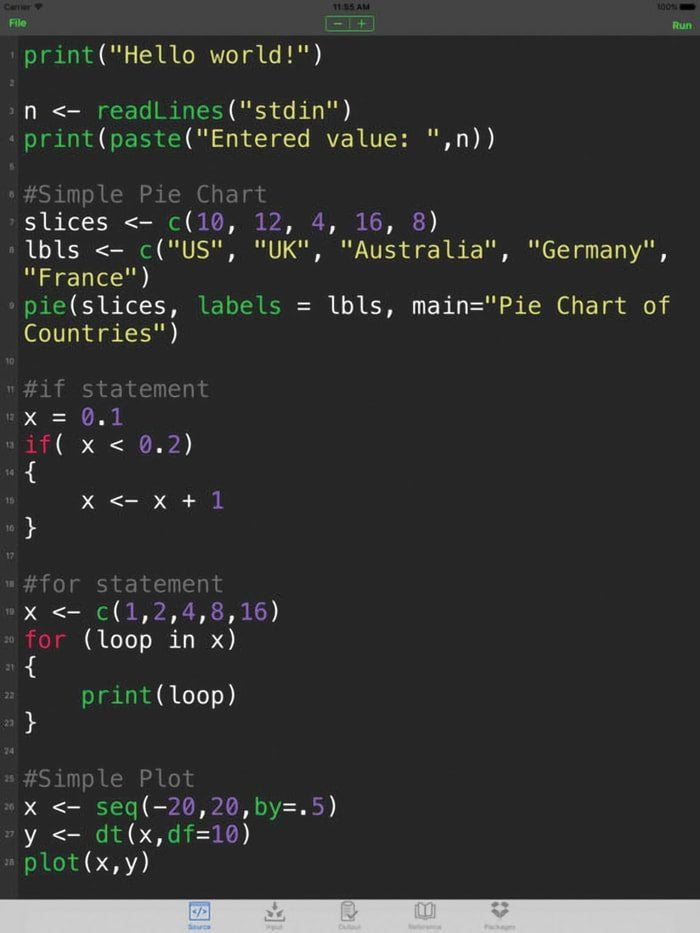
R is an open-source programming language used for statistical computing and graphics and is very easy to learn.
R is well suited to statistical calculations, while the visualization tools included within make it a great language for compelling graphics like scatter plots and graphs.
Tableau
Tableau is a free tool that connects any data source like Warehouse, Maps, and dashboards, with real-time updates presented on the web.

Undoubtedly, Tableau is one of the most popular data visualization platforms in the world of business because it features an easily understood user interface and seamlessly turns data sets into comprehensive graphics.
Business users enjoy it because of its service and data analysts like it. After all, it packs powerful tools that can perform advanced analytic functions.
MySQL( Structured Query Language )
MySQL is an open-source relational database management system (RDBMS) used for storing application data, particularly web-based ones. Popular websites MySQL has been used such as Facebook, X, and Youtube.

MySQL is used for managing relational database management systems which are structured into tables. As a result, data professionals use MySQL to store data securely and perform routine data analysis.
Conclusion
Data Analysis is one of the high-paying digital skills. However, it’s a technical skills that requires a high level of expertise.
But with the introduction of these tools: Python, Microsoft Excel, R- Programming, and others.
They would help in minimizing the work load on a data analyst while ensuring a productive and optimum output.